Using iNaturalist Phenology Data
I’ve recently started annotating the phenology of iNaturalist observations of Malacothamnus to see how useful this would be for my research. Phenology is most prominent in climate change research at the moment where researchers are trying to document shifts in flowering time due to climate change. It is also useful in assessing possible reproductive barriers between species. For plant groups that can hybridize like Malacothamnus, geographic distance between species is a major reproductive barrier, but for those growing near each other, offset flowering times can reduce gene flow. Using a combination of iNaturalist observations, herbarium specimens, and other data resources, I can get a better idea of when different Malacothamnus are doing what phenologically.
To start, it is worth taking a look at an iNaturalist plant profile where you can see the phenology data displayed. Here is the profile for Malacothamnus fasciculatus var. nuttallii (Nuttall’s bush-mallow) which should look something like this:
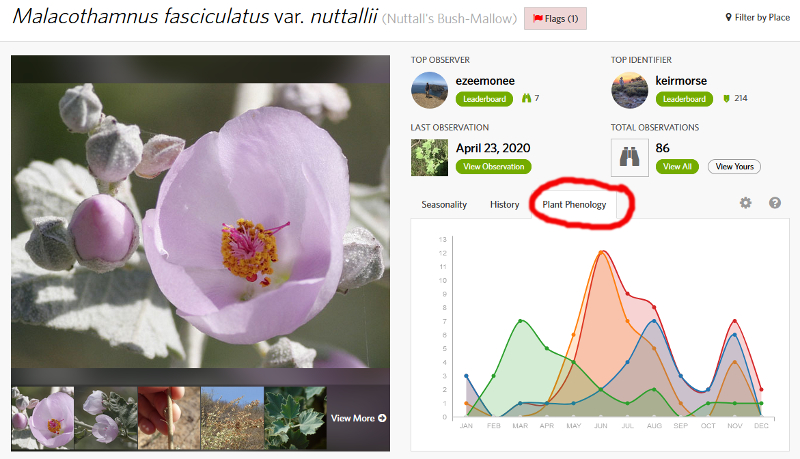
If you click on the “Plant Phenology” tab I’ve circled in red above, you can see the phenology data as currently annotated in iNaturalist. If you hover over the phenology chart, you will be shown a legend that tells you what each of the colors mean and will show you the count of each annotation category for the month you hover over. Also note that you can filter by place (top right), so you could compare the phenology of the same species in two or more locations such as San Diego County, CA vs. Orange County, CA.
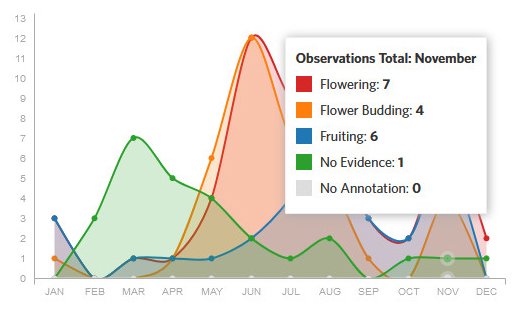
There are five possible phenology categories. You can include flowering, flower budding, and fruiting all on the same observation. It is common in Malacothamnus to be at all three of these stages at once. “No evidence“ means there is no evidence of reproductive parts. In general, this will mean a vegetative plant, but could also mean the photo is not adequate enough to assess the phenology. “No annotation” is for observations that have not been annotated. If you hit the cog symbol, you will see an option to annotate those observations needing annotation. Pick a favorite plant and give it a try. If you do annotate, make sure you know enough about the plant you are annotating to add all stages that are in the photos and look at all the photos for each observation. If you aren’t sure about one, skip it and annotate a more obvious one.
Let’s look at some examples of what I’ve found so far.
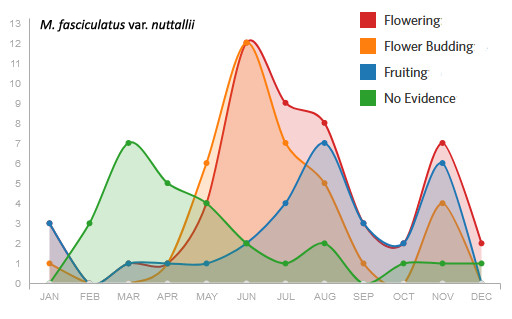
Above is M. fasciculatus var. nuttallii. This is a fairly decent example of when there is a good amount of data. The green area in the spring shows that people have mapped plants when they are vegetative. That is often not the case. You can see both budding and flowering peak in June, but budding drops on and fruit starts to increase in July. There is an interesting gap in September and October. Many Malacothamnus drop their leaves around this time of year to start growing new ones. Is that why there is a gap? Also note that flowering picks up again in November. Some Malacothamnus will keep having sporadic flowers into the fall, though these are usually just a few flowers or inflorescences on plants that are mostly in late fruit.
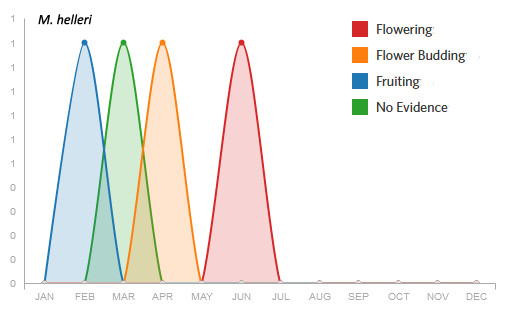
On the opposite end of the data spectrum is M. helleri which only has a single observation in each phenology category. Slightly helpful, but not much.
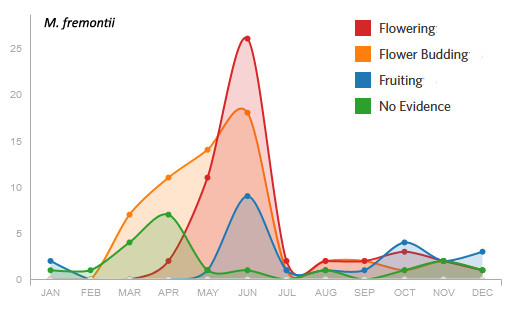
The M. fremontii data look great until June, but it appears that starting in July no one wants to record observations of them. Are they so ugly as to be unmappable this time of year or does everyone just go somewhere not as hot?
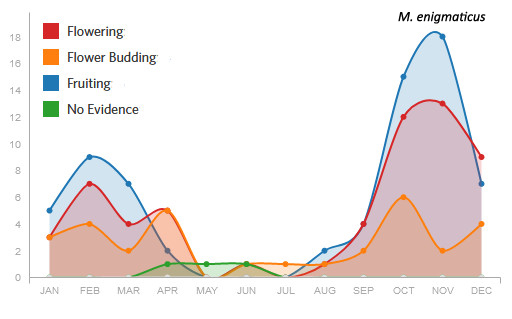
M. enigmaticus shows some interesting data bias. This species has a peak bloom from June-August, so why does this chart seem to indicate the opposite? Most of this data was collected by Fred Melgert and Carla Hoegen (efmer) who have done a wonderful job documenting M. enigmaticus. However, they focus their hikes on the lower elevation part of the range of the species and live elsewhere during the summer. This is a great example of where lack of data during some months can really misrepresent the pattern of phenology when viewed for the full year.
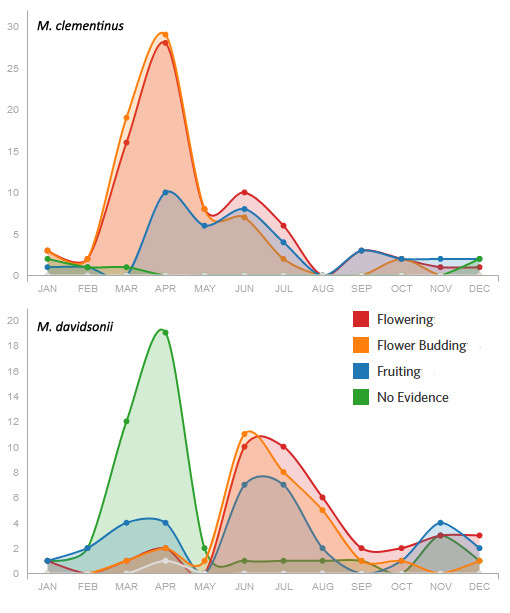
Above you can see the early flowering M. clementinus (top) compared to the late flowering M. davidsonii (bottom). Note how great it is to have the vegetative data for M. davidsonii, but what happened in May? Why the data gap?
All of the above were all examples of just iNaturalist data. The group I’m most interested in for phenology is the M. jonesii complex which includes M. niveus and M. gracilis. These three species, which are all included in M. jonesii in some treatments, grow adjacent to each other, but appear to have both morphological and flowering time differences that correspond to geography. They also have intermediates. So, if they aren’t good species yet, maybe they are on their way to becoming ones? There wasn’t much iNaturalist data on these, so I combined iNaturalist, Calflora, Calphotos, and herbarium specimen data to produce the following.
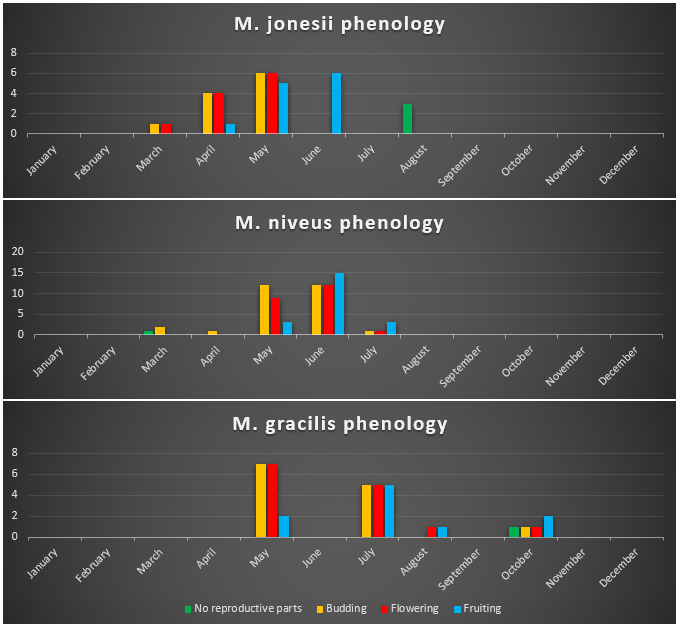
There are still some major data gaps, but note that M. jonesii is flowering in March and April while the others aren’t and M. gracilis appears to flower longer than the rest. They do all overlap in May, but my current data shows M. jonesii is known to flower from March 15 until May 15 whereas the earliest bloom day of M. niveus is May 4 and the earliest of M. gracilis is May 5. That allows only 9-10 days of overlap between M. jonesii and the others when M. jonesii may have already been blooming for a month and a half. So, possibly good evidence for at least partial divergence, but note the lack of data in April for M. niveus and M. gracilis. It may be that people didn’t collect then because there weren’t flowers, but there are also many herbarium specimens I haven’t examined yet.
In conclusion, the point of this was to show the very exciting possibilities of iNaturalist phenology data along with some of the possible problems. There are some fairly easy ways to significantly improve this data.
First, adopt a species (or more) that you feel comfortable accurately annotating the phenology on and do so. Are there differences between two related species that grow together or near each other? Are there gaps in phenology that should be filled in? If you do annotate, make sure you annotate all stages found for each observation.
Second, take iNaturalist observations of the same species year around or as long as they can be found. If you regularly visit the same area, you can document the same plant or group of plants once a month (or even more) to see how they change.
Third, if you know of a species near you that has gaps in the phenology data, try to fill them in with your own observations. I’ve provided a few examples of data gaps above, but there are probably gaps for most species.


Comments
Fantastic work!
Couldn't agree with you more. Thank you for the post!
I enjoyed reading this and the graphs.
I saw the Malacothamnus gracils flowering May 1, 2020! I would say, out of all the shrubs I saw, there was only one or two I found flowering that day, so it was at the start of flowering. Now, a few weeks later, more are flowering, and budding, but not all are flowering.
https://www.inaturalist.org/observations/44561388
Great suggestions on documenting local phenology for these Malacothamnus and other species!
Perhaps you could lend your voice to my request to add leaf phenology to iNaturalist on the forums? https://forum.inaturalist.org/t/lets-talk-annotations/627/298?u=yerbasanta
I think the annotations are reviewed by a moderator who self-admittedly 'doesn't know plants', so it's a higher bar to demonstrate the use case for them, though a specific PhD project may help since you mention the relevance to fruiting.
@yerbasanta I haven't signed up for the forum yet, though I probably should. I see there is a feature request section and it looks like your request isn't in that section. Have you tried posting there? Hopefully you can get a good discussion there. Seems like a good idea but there are endless things that could be added and maybe they are just trying to keep the basics very minimal. Other people are using observation fields to customize data they want but it is nice to have it all in one place.
^This^ is why I care about adding annotations! Though I'm doing so for insect groups, it's just as handy. Thanks for sharing your insights--I hope it'll encourage more observers to add annotations to their own observations.
There's now a forum thread on phenology annotations and this post in particular. It also explains how to change your browser security settings to allow "mixed mode" security and view the images.
How exactly was the data generated for those graphs? I am trying to find if there is a way to download the info - last time I tried, I got an empty set
@lyndalt The data is generated by just annotating the phenology on each observation. With the exception of the bottom graph, the others are all displayed on each inat taxon page. I'm not sure if there is a way to download the data except maybe through the API. You'd have to ask in the forum as I have no idea how that works. In the case of Malacothamnus, a plant could be in bud, flowering, and in fruit at the same time, so not sure if you could download multiple stages for the same observation, that would be ideal though. For the bottom graph, I just added what I saw in the iNat graph to a spreadsheet and then added additional data from herbarium specimens. The iNat graph shows you the total for each stage for each month when you hover over each month. If there are too many with "no annotation", hit the cog and select "add annotations for plant phenology".
Add a Comment