150,000,000 observations on iNaturalist!
This week we passed 150 million observations! While the number of observations has been growing steadily over time, observations per month passed 5 million for the first time this summer.

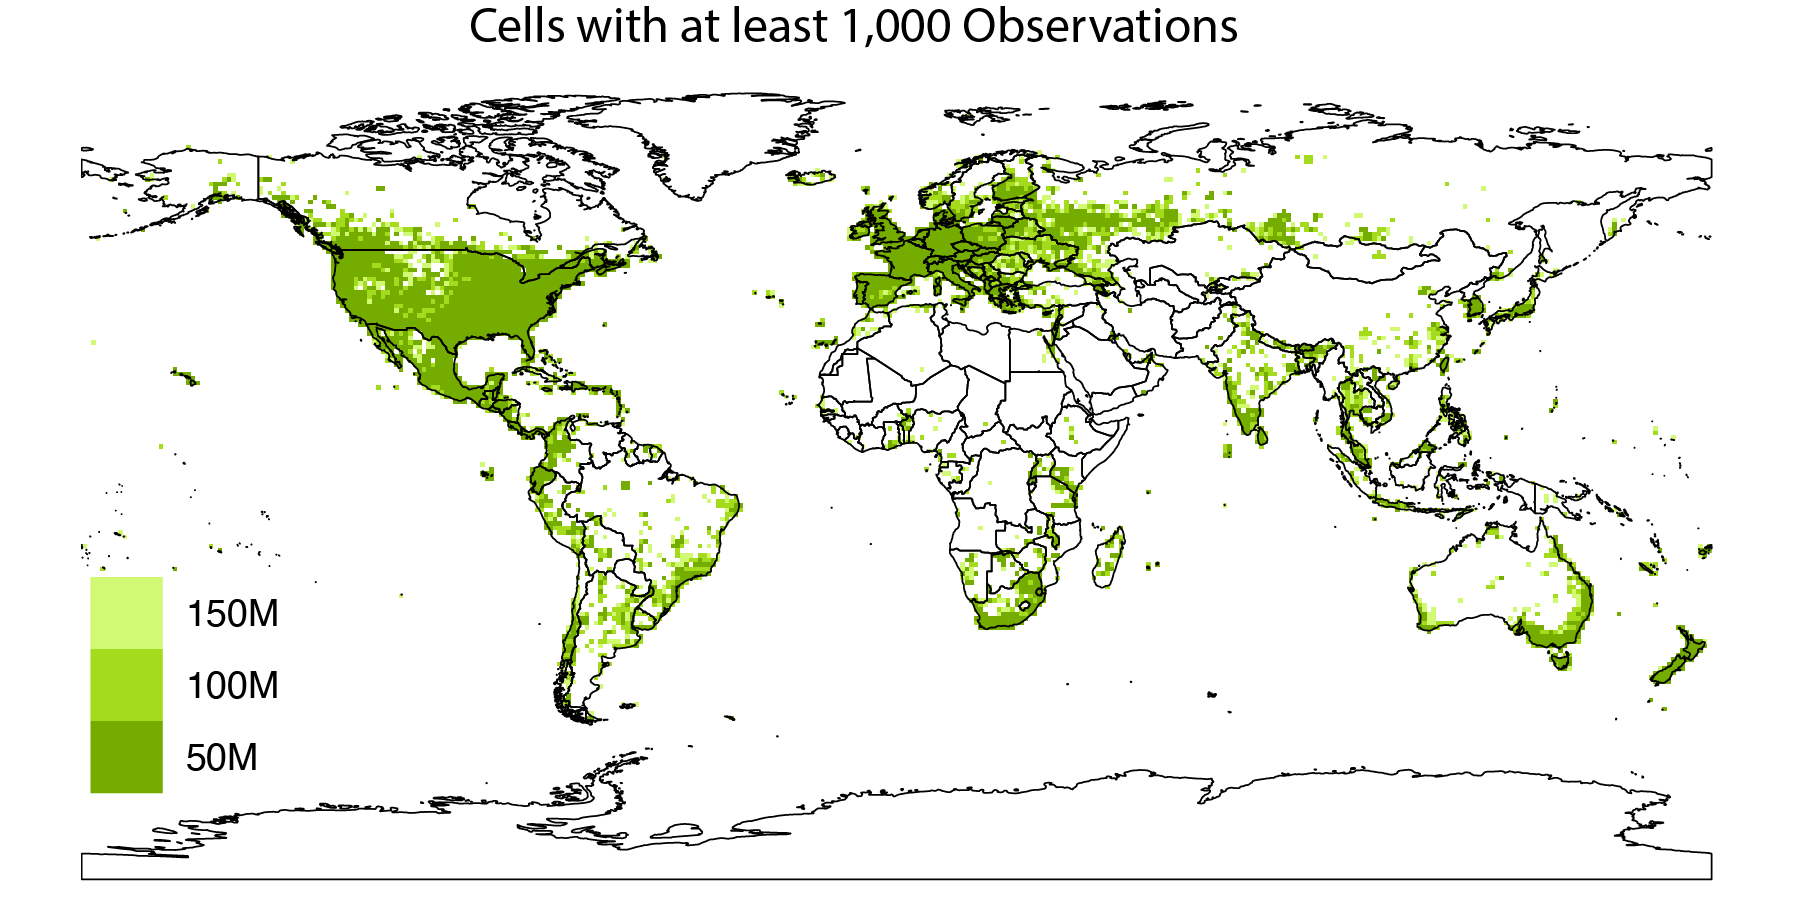
These observations aren’t equally distributed across space. The map below bins observations in each of 64,800 1x1 degree grid cells covering the globe. Most are in North America and Europe and other hotspots like Taiwan, Eastern Australia, Cape Town etc.

In the past posts, we’ve explored how observations are unevenly distributed across species. In the graph below, we’re doing the same with land area. The black line ranks all land surface (excluding Antarctica) 1x1 degree cells by number of observations. On the left are cells that encompass very observose cities such as Hong Kong with nearly 1 million observations. On the right are cells with very few observations such as the cell encompassing Kananga in the Congo Basin of Africa with just 3 observations. 40% of non-Antarctica land surface cells have no observations at all.

This graph shows how that line has shifted to the right as iNaturalist has grown from 50 million observations (dark green line) to 100 million observations (middle green line) and to 150 million observations (light green line). The percentage of land surface excluding Antarctica with at least 1,000 observations has grown from 12% to 20% with this tripling of observations.

This 1,000 observation threshold is a totally arbitrary cutoff representing grid cells with reasonably high densities of observations. Mapping them we can see light green (cells reaching 1,000 observations from the most recent 50 million observations) encroaching into gaps on the map. As is the case with tallying rare species, tallying observations from remote places proceeds much slower than the overall number of observations since most observations come from a relatively small number of places.
The graph below shows these changes in the percentage of cells with at least 1,000 observations for the United States, China, Africa, and Europe (excluding Russia which spans Europe and Asia).
In Europe (excluding Russia) and the United States, most cells now have over 1,000 observations (78% and 70% respectively). However, the percentage of cells with over 1,000 observations in Europe has increased relatively rapidly (from 53% to 78%) as observations across Eastern Europe fill in. In contrast the percentage of cells in the US is increasing more slowly (from 61% to 70%) as the remaining cells with few observations are in remote areas like northern Alaska. In Africa and China the percentages of cells with at least 1,000 observations is much lower (14% and 9% respectively).

Many parts of the world have few observations because they are so remote and so few people live there. It’s unclear what we can do to encourage more observations from such places. But as projects like City Nature Challenge show, it’s possible to get lots of participation from places where lots of people live. The graph below shows the 590 cities with populations over 750,000 people in 2010 ranked by number of observations. Cities in North America and Europe are colored in green while cities in Asia and Africa are in gray. Cities from other continents are shown in white. Most of the places in the world where lots of people live and we have few observations are in Asia and Africa. Engaging more people who live near these cities will be important part of increasing the geographic distribution of iNaturalist observations moving forward.

Thank you to everyone who has contributed to this 150 million observation milestone! If you’re inspired to donate, you can do so via the link below.


Comments
Incredible!
This is so cool! It makes you want to get out and fill out those less-observed cells on the map. Thanks for all the hard work done behind the scenes.
Congrats !!
Woohoo! Love the charts and maps. Mexico, Central America and Ecuador also appear to have high coverage of cells with >1k observations.
I will try to go north in the summer... at some point.
Looks like I glommed on about 11/2016. I was at an event at the SD Zoo, and some random guy came up to me and asked if I'd ever heard of iNat and that I should look into it. So I did -- at time when it looks like the average amount of posting were about 100,000/month. Now it's well north of 5 million/month when it's humming. Proud that I'm now 11,000+ posts deep with a pretty good range (including that sparse area in N. Dakota!) -- and always willing to look for more!!
awesome graphics - would be nice to have a spreadsheet of the city stats
To encourage new iNatters in the gaps - please help to ID around City Nature Challenge and the upcoming Great Southern Bioblitz. That is our window to find and retain new observers, and identifiers.
And especially to find not yet on iNat species. Better yet, so new it is still in press! Always something new out of Africa (misquoting Pliny)
https://www.inaturalist.org/observations/135544622
Amazing! Such good news. Whenever there are posts like this, I share them on social media and invite people to sign up. The Year in Review posts are great. Have you considered doing monthly or quarterly review posts? I'd certainly read and share them. There's something amazing about being part of a collective project that both documents the most wonderful things in the world, and also advances the cause of preserving them. Not to overstate things, but there is something sort of religious about it: being part of a shared project involving wonder and dedication to a cause.
Having evangelized for it, my sense is that the biggest obstacle to wider and more rapid adoption is the clunkiness of the app. I sort of like the clunkiness--it's clear that the scientific project is more important than the consumer experience. But if someone wants to make a $100,000,000 donation to the project, I'd argue for redesign of the app that makes it easier and quicker to use. For instance, there is a significant time lag between opening the app, hitting the "observe" button, taking a picture, hitting "use picture," and hitting "share." In those precious seconds, birds fly away, as does one's patience. Same story with "suggest identification." It would be great if that auto-populated, so you would't have to go through changing "unknown" to "American Sycamore" on dozens of observations. I realize there are benefits to making users take the first step. But it seems like something there could be improved.
Anyway: these are critiques of the friendliest kind. Thanks a 150,000,000 to all who make INaturalist what it is!
Wonderful to be part of this amazing initiative!
@raphael1c observing with regular phone camera is much easier and faster, plus, if you can, upload via computer.
Amazing! 3 years ago there weren't even 50M observations!
Kudos!!
Yay! We should all celebrate! And keep working towards the next milestone!
So wonderful to see this exponential growth -- I know it comes with a fair share of challenges, but the reality is this number of observations shows more and more engagement with nature from more and more people around the world. That's a good thing! :) I know that it's radically changed the way that I go outside! Way to go, iNat community! Happy to donate to such a great cause!
I love iNaturalist for so many reasons. I love adding to the data and I also love exploring the data. When preparing for travel, it is fun to look for specific plants in the area in iNaturalist in case some are close by where I am going so I can go see them, or, just know they are there. As a member of the Texas Native Plant Society, and avid gardener, I can look up the natural range of various native Texas plants. Thanks for iNaturalist! I adore it!
So who's going to take one for the team and start exploring Antarctica and Greenland? Lol!
In the first graph its amazing to see just how big the dip is in observations between the summer and winter months in the Northern hemisphere. I knew the vast majority of observations came from the USA and Europe, but to see such a dramatic difference just further highlights the need to increase participation across other regions.
I'm from the USA so I guess I'll have to move to Alaska to fill up some squares up there haha.
Great! Are the interactive versions of the graphics, for example to explore details for a specifig region?
Educational channels are the way to engage more people in Africa and Asia. iNaturalist scholarships and/or awards could be made for students and teachers who further the goals of iNaturalist there. Teaching packs in local languages could be made for biology teachers.
As expected, the gaps come out in specific biomes: Taiga, Tundra, Desert, and the parts of rainforest basins away from the main river corridors. I note that both hot and cold deserts are gaps -- the Sahara and Arabian Peninsula, but also the Tibetan Plateau and the "Stans." What intrigues me more, though, is that the Sahara and Congo gaps are connected, even though the transition between them is Savanna, a biome which is in other respects well represented.
What an opportunity for the adventurous traveler.
Great!
I think the staff has been modest. There are 168,835,011 observations in iNaturalist.
I have contributed 0.009616% of these observations! Felicitaciones, equipo iNaturalist!!!
The power of community
Maravilha
Nice analysis - love to see this. I'm curious what map projection is used, and whether you might consider an equal-area projection for future maps. You wouldn't know from this map that Brazil is four times the size of Greenland!
Yes please to an equal area projection across iNat.
https://forum.inaturalist.org/t/world-map-representation-is-mercator-the-most-adequate-for-inat/7806/
Nice coinage of "observose" there. I will try to find ways to slip it into casual conversations.
would love to know some buckets nearby that do not have the 1k mark. Btw currently 172k observation of which 154k are verifiable
Add a Comment