Sierra Nevada Challenge 2019: Updates!
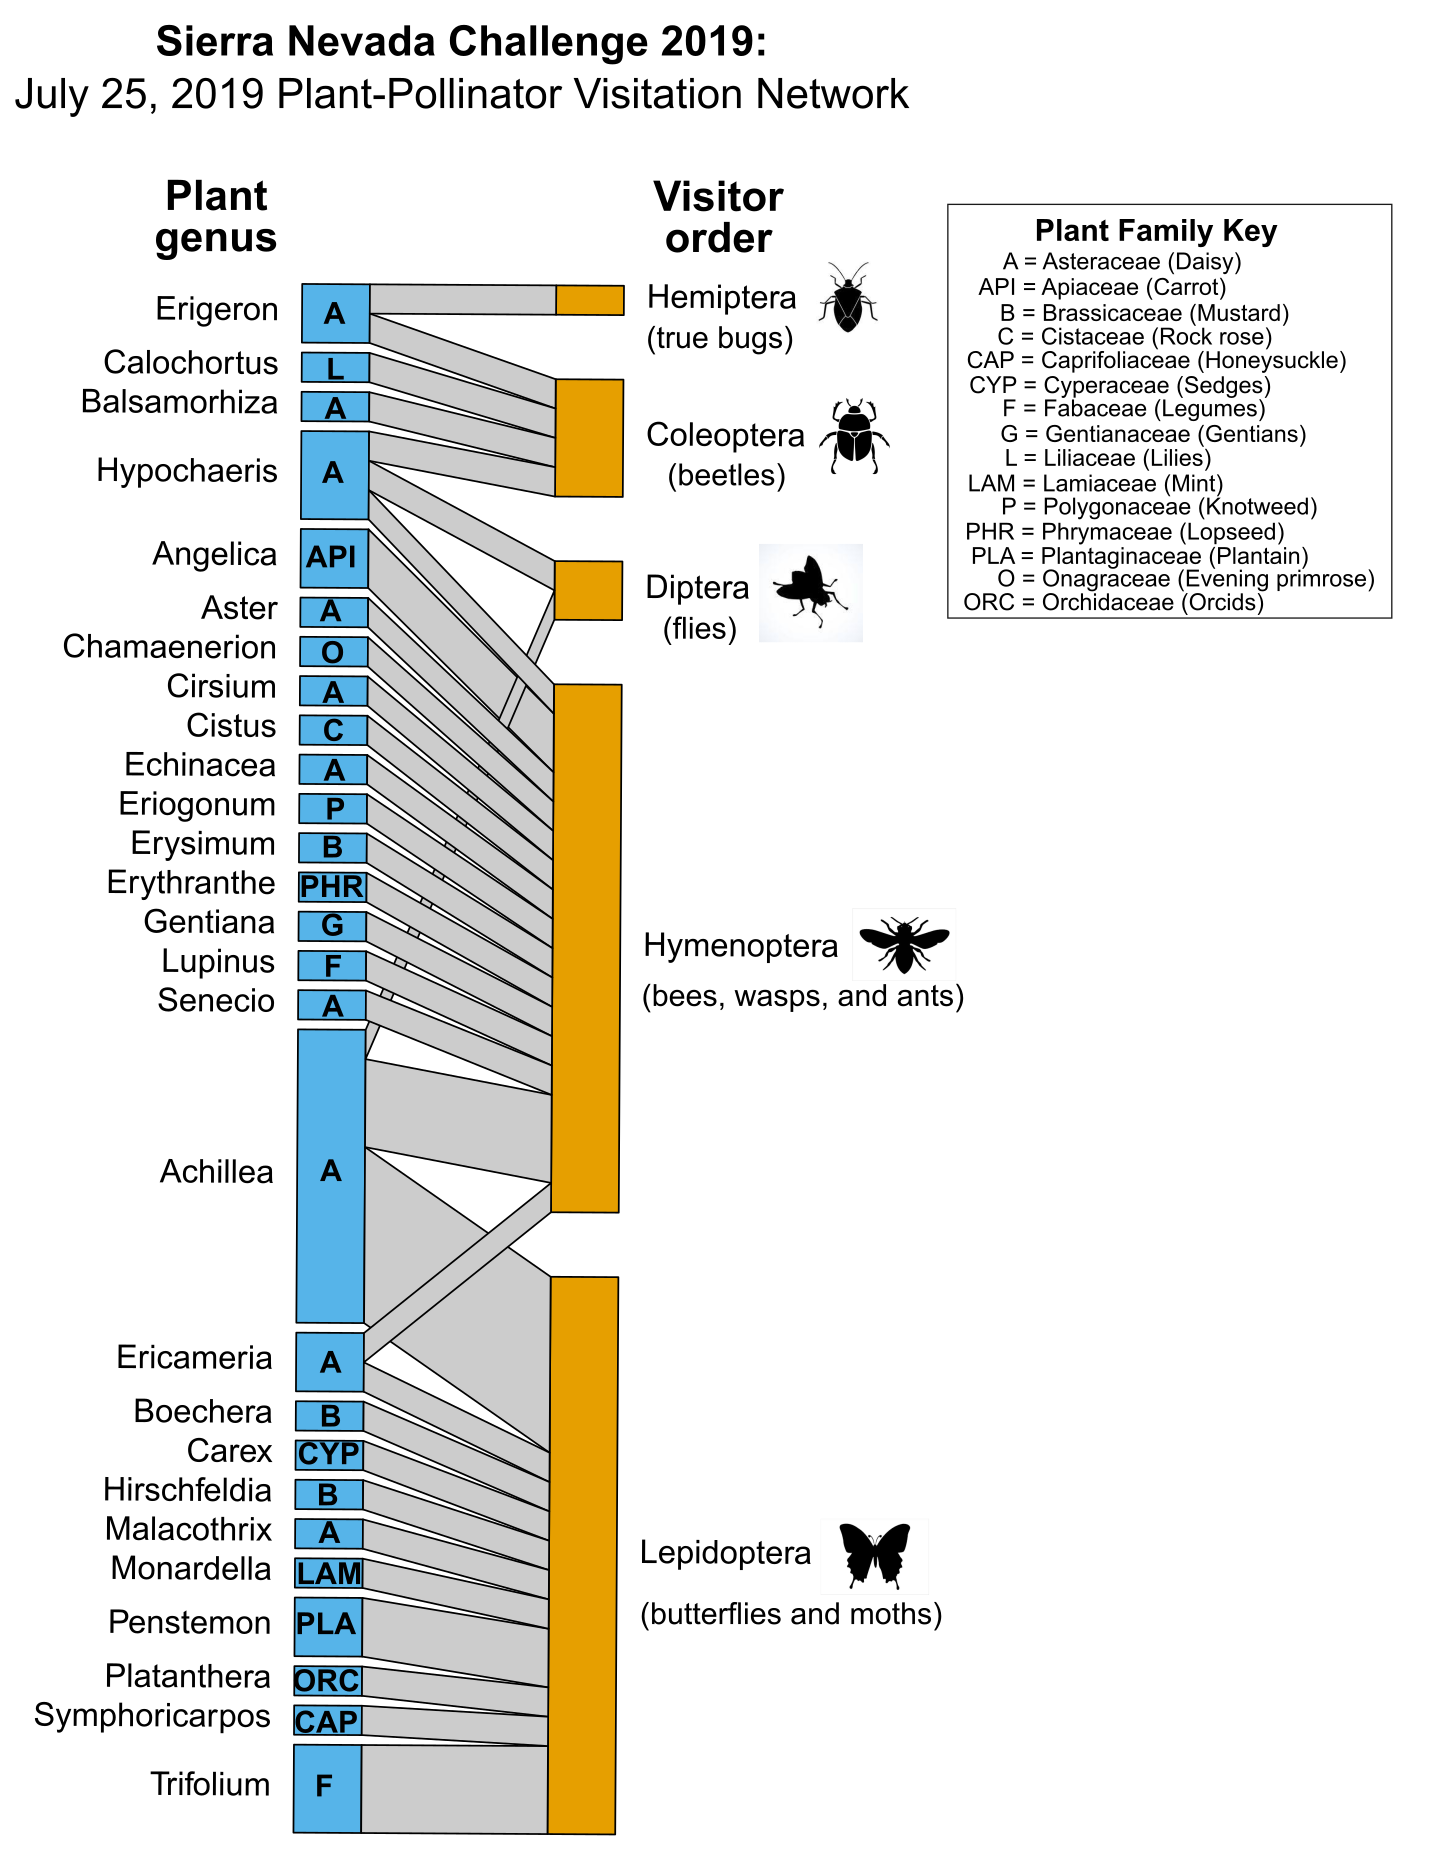
We have 33 new plant-pollinator visitation interactions at the plant genus : visitor order taxonomic level! Here I am sharing an interaction network diagram; it's like a map of the plants and pollinators that interact with one another. The plants are on the left side and the (potential) pollinators are on the right. If there is a grey line between them, that means that they interact! You might notice that those grey lines are different widths or thicknesses; this means something! The wider the interaction line, the more times that type of interaction has been observed.
Check out what your data made:
Posted on
July 26, 2019 04:13 AM
by
 jennyh


Comments
Add a Comment